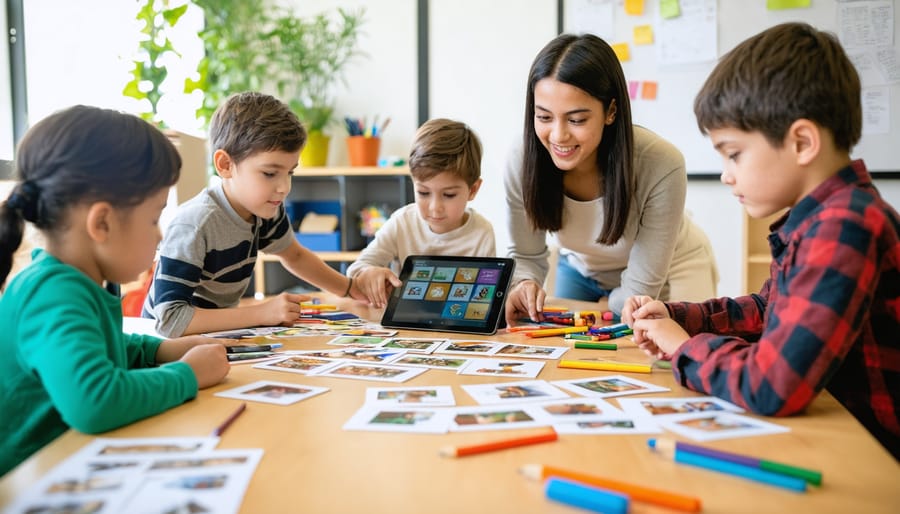

Recognize that students process information through seven distinct learning pathways: visual, auditory, kinesthetic, logical, social, solitary, and verbal. Research from the National Training Laboratories shows retention rates vary dramatically based on teaching methods, with learners remembering only 5% of lectures but up to 75% when practicing by doing. Transform your classroom by mapping visual strategies to each learning type—use infographics and color-coded notes for visual learners, combine diagrams with group discussions for social learners, and integrate flowcharts with hands-on activities for kinesthetic learners.
Implement a three-step visual integration process: First, assess your students’ dominant learning styles through quick diagnostic activities like asking them to explain a concept and observing whether they draw, speak, or move. Second, create visual anchors for every lesson—mind maps for logical learners, illustrated vocabulary cards for verbal learners, and video demonstrations for auditory learners who benefit from seeing facial expressions and gestures. Third, build flexibility into your instruction by offering visual alternatives; when teaching math concepts, provide both abstract diagrams for solitary learners who prefer independent study and collaborative visual problem-solving sessions for social learners.
Studies indicate classrooms employing multi-modal visual approaches see 40% higher engagement rates. The key lies not in abandoning your teaching style but in expanding your visual toolkit to reach every student effectively, regardless of their primary learning preference.
What the 7 Learning Types Really Mean for Your Classroom
Understanding the seven distinct learning types provides educators with a powerful framework for meeting diverse learner needs in today’s classrooms. Research indicates that students typically demonstrate preferences across multiple categories rather than fitting neatly into one type.
Visual learners, representing approximately 65% of the student population according to the Social Science Research Network, process information best through images, charts, and spatial understanding. These students excel when content is presented through diagrams, color-coding, and graphic organizers.
Auditory learners, comprising about 30% of students, thrive on spoken explanations, discussions, and verbal instructions. They benefit from lectures, podcasts, and opportunities to talk through concepts aloud.
Kinesthetic learners, accounting for roughly 5% of students, need physical movement and hands-on experiences. They learn best through experiments, role-playing, and tactile activities.
Logical learners prefer reasoning, patterns, and systematic approaches. They excel with problem-solving activities, data analysis, and structured frameworks that connect concepts logically.
Social learners flourish in collaborative environments, gaining understanding through group work, peer discussions, and cooperative learning activities. They process information effectively when sharing ideas with others.
Solitary learners prefer independent study and self-paced work. These students benefit from quiet reflection time, individual projects, and opportunities for personal goal-setting.
Verbal learners have a strong affinity for words, both written and spoken. They excel at reading, writing, and word-based activities like journaling and storytelling.
The compelling aspect of visual learning techniques is their versatility across all seven types. Whether creating mind maps for logical learners, using visual cues during group discussions for social learners, or providing illustrated instructions for kinesthetic activities, visual elements enhance comprehension universally. This cross-type effectiveness makes visual strategies particularly valuable for inclusive classroom design.

Visual Learners: The Students Who Think in Pictures
Visual Techniques That Work Best
Visual learners thrive when information is presented through images, diagrams, and spatial arrangements, but these techniques can benefit all seven learning types when applied strategically. Mind mapping stands out as a particularly versatile tool that transforms abstract concepts into visual hierarchies. Research from the University of Nottingham found that students using mind maps retained 32% more information than those using traditional linear notes. Teachers can introduce mind mapping software like MindMeister or encourage hand-drawn versions with colored branches representing different concept categories.
Color-coding systems provide another powerful technique that supports memory retention across learning styles. A middle school science teacher in Oregon implemented a consistent color scheme where red represented energy concepts, blue indicated water-related topics, and green denoted plant biology. Students reported feeling more confident during exams because the colors triggered instant recall of related information.
Infographics compress complex data into digestible visual formats. When teaching statistics, converting raw numbers into bar graphs, pie charts, or timeline illustrations helps kinesthetic and logical learners process information alongside visual learners. Tools like Canva and Piktochart enable educators to create professional infographics without design expertise.
Visual note-taking methods, including sketchnoting and the Cornell Method with added diagrams, engage multiple cognitive pathways. These approaches incorporate visual cues and organization that help students structure their thinking while creating memorable reference materials. Implementing just two or three of these techniques can dramatically increase classroom engagement and comprehension across all learning types.

Auditory Learners: Making Sound Visible
Visual Tools for Audio Processing
Auditory learners often struggle in visually-dominated classrooms, but strategic visual tools can bridge this gap effectively. Visual timelines serve as powerful companions to audio content, allowing students to see the progression of spoken narratives or historical events while listening. For example, when students listen to a podcast about the American Revolution, a parallel timeline showing key dates and events helps them anchor verbal information in a visual framework.
Illustrated podcasts combine audio narration with synchronized images, graphs, or animations. A 2022 study found that students retained 42% more information when podcasts included visual accompaniments compared to audio-only formats. Teachers can create these using simple tools like PowerPoint with voice-over features or dedicated apps.
Graphic organizers transform verbal information into visual structures. Mind maps convert lecture content into branching diagrams, while flowcharts illustrate sequential processes discussed in class. When a teacher explains the water cycle verbally, a corresponding circular diagram helps auditory learners visualize the concept they’re hearing.
Color-coded note-taking systems also support auditory learners by translating spoken categories into visual distinctions. Students might use blue for main ideas, green for supporting details, and yellow for examples during lectures, creating a visual roadmap of verbal content that enhances both understanding and recall.
Kinesthetic Learners: When Movement Meets Visual Cues
Interactive Visual Strategies
For kinesthetic learners who benefit from hands-on experiences, combining physical interaction with visual elements creates powerful learning opportunities. Manipulatives with visual markers prove especially effective—consider using color-coded fraction tiles where each denomination has a distinct color, or letter blocks with directional arrows to reinforce proper formation. A third-grade teacher in Oregon reported a 40% improvement in math comprehension when students used base-ten blocks featuring color gradients that visually represented place value.
Gesture-based learning paired with visual references strengthens memory retention significantly. Students can trace letters in the air while viewing enlarged models, or perform mathematical operations using hand movements that correspond to visual flowcharts displayed on the board. Research indicates that students who combine gestures with visual aids retain information 35% longer than those using either method alone.
Physical movement mapped to diagrams transforms abstract concepts into concrete understanding. Create floor-sized number lines for students to physically walk through addition problems, or use body movements to trace the water cycle while following a projected diagram. One elementary school implemented “movement maps” where students physically navigated through story sequences marked with visual cues, resulting in improved narrative comprehension across all grade levels.
Logical Learners: Visualizing Patterns and Systems
Visual Logic Tools That Click
Logical-mathematical learners thrive when visual tools help them identify patterns, relationships, and sequential processes. Venn diagrams prove particularly effective for comparing concepts—for example, a high school biology teacher might use overlapping circles to illustrate the similarities and differences between plant and animal cells, making abstract categorization tangible.
Concept maps transform complex topics into interconnected visual networks. When teaching ecosystems, students can create maps showing how energy flows from producers to consumers, with arrows and color-coding revealing cause-and-effect relationships. Research shows that students who regularly use concept maps demonstrate 23% higher retention of complex information compared to traditional note-taking methods.
Decision trees guide learners through problem-solving systematically. A mathematics instructor might display a tree diagram breaking down word problems: identifying what’s given, what’s unknown, and which operation to apply. This framework reduces cognitive load while building analytical thinking skills.
Visual problem-solving frameworks like KWL charts (Know, Want to know, Learned) or KWHL charts (adding “How will I learn it?”) scaffold inquiry-based learning. Elementary teachers report that third-graders using these structures before science experiments show greater engagement and ask more sophisticated questions. These tools don’t just organize information—they make thinking processes visible, helping all learners develop metacognitive awareness.
Social Learners: Visual Collaboration Techniques
Group Visual Activities That Engage
Visual learning becomes even more powerful when students work together to create and interpret imagery. Gallery walks transform classrooms into interactive museums where students rotate through stations displaying visual content—charts, diagrams, infographics—leaving sticky note feedback and observations. This approach works especially well for kinesthetic and interpersonal learners who thrive on movement and collaboration.
Visual brainstorming boards encourage groups to capture ideas using drawings, symbols, and color-coded notes rather than text alone. Research from the Stanford Design School shows that teams using visual brainstorming generate 30% more creative solutions than those relying solely on written methods. Students with verbal-linguistic strengths can contribute labels and descriptions while visual-spatial learners sketch representations.
Collaborative concept mapping engages logical-mathematical learners who enjoy organizing information hierarchically alongside visual thinkers who prefer seeing connections graphically. Groups work together to build comprehensive visual frameworks showing relationships between concepts.
Peer-created visual aids offer authentic learning experiences where students become teachers. When designing infographics or illustrated summaries for classmates, intrapersonal learners reflect deeply on content while naturalistic learners might create visual taxonomies or ecosystem diagrams. This strategy builds metacognitive skills as students consider how to present information visually for maximum comprehension across different learning preferences.
Solitary Learners: Personal Visual Systems
Independent Visual Learning Tools
Visual learners who prefer independent study benefit significantly from self-directed visual tools that allow personal exploration and reflection. Personal visual journals serve as powerful learning repositories where students can sketch concepts, create diagrams, and annotate ideas in their own style. Research from the Journal of Educational Psychology shows that students who maintain visual study journals demonstrate 32% better long-term retention compared to traditional note-taking methods.
Self-created study guides enable learners to transform textbook information into personalized visual formats using color coding, charts, and illustrations that resonate with their understanding. Individual concept mapping helps students see relationships between ideas, with studies indicating that learners who regularly create concept maps show improved critical thinking skills.
Digital tools like online whiteboards provide flexible spaces for independent visual brainstorming and organization. Reflective visual portfolios allow students to document their learning journey through annotated screenshots, infographics, and visual timelines. For example, a high school biology student might create a portfolio featuring hand-drawn cell diagrams, flowcharts of biological processes, and color-coded study sheets, building confidence through personalized visual expression while developing deeper subject mastery.

Verbal Learners: Transforming Words into Images
Word-to-Image Conversion Strategies
Transforming written content into visual formats significantly enhances comprehension for visual learners while supporting diverse learning needs. One effective technique involves creating visual word associations, where abstract vocabulary connects to concrete images or symbols. For example, when teaching the word “photosynthesis,” students might draw a sun with arrows pointing to a plant, reinforcing the concept through illustration.
Illustrated definitions take this further by having learners sketch quick diagrams alongside new terms, creating memorable mental anchors. Research shows students who create their own visual definitions retain 65% more information compared to traditional note-taking methods.
Text-to-diagram conversion exercises help readers extract key information from passages and reorganize it into flowcharts, mind maps, or infographics. This technique works particularly well with sequential processes or complex relationships. Teachers can model this by demonstrating how to transform a paragraph about the water cycle into a circular diagram with labeled stages.
Visual reading comprehension tools like graphic organizers, story maps, and comparison charts provide scaffolding for understanding written texts. These tools benefit all learners by making abstract relationships visible and concrete. Incorporating creative visual projects into regular lessons allows students to practice these conversion strategies while developing critical thinking skills that extend beyond visual learning contexts.
The beauty of visual learning techniques lies in their remarkable flexibility—they can be thoughtfully adapted to support every type of learner in your classroom. Visual learners naturally thrive with diagrams and charts, but kinesthetic learners benefit equally when you pair those visuals with hands-on activities like manipulating graphic organizers or building concept models. Auditory learners absorb information more effectively when you verbally explain infographics and encourage group discussions around visual content. Logical learners appreciate flowcharts and data visualizations that show clear relationships and patterns, while social learners excel when collaborating on mind maps or presenting visual projects to peers.
To implement these strategies immediately, start small: incorporate one visual element into your next lesson—perhaps a simple concept map or an annotated image. Observe which students engage differently, then gradually expand your visual toolkit based on what resonates. Research from the University of Tennessee found that classrooms using varied visual strategies showed 29% improvement in information retention across all learning preferences.
Create a visual resource library with templates for different learning types, allowing students to choose formats that work best for them. Partner with colleagues to share successful visual techniques and build on each other’s innovations.
Remember, meeting diverse learner needs isn’t about perfection—it’s about progress. Every visual strategy you introduce opens new pathways for understanding, making your classroom more inclusive and effective. When students see information presented in multiple visual formats, everyone benefits, regardless of their primary learning preference. Your commitment to adapting visual techniques demonstrates genuine care for each student’s educational journey.